
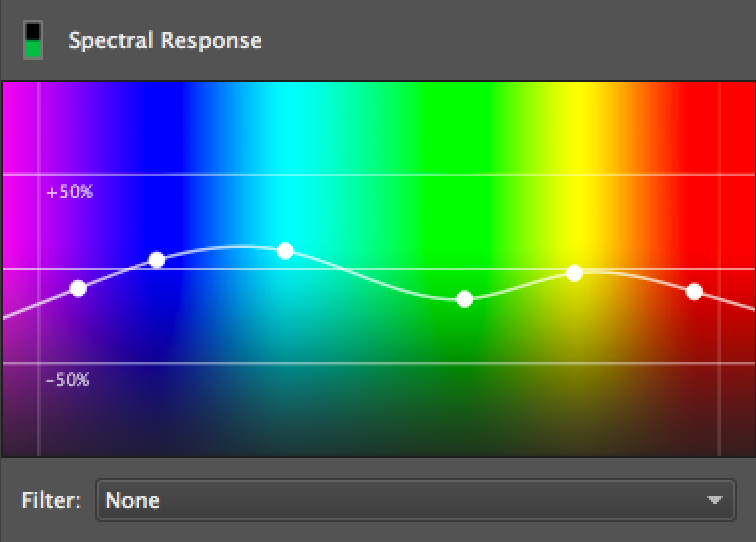
Black and white film stocks respond differently to different wavelengths of light (colors). In TrueGrain, this particular behavior is expressed during grayscale conversion and is directly related to saturation.
Each film implemented in TrueGrain is carefully profiled for its spectral response (how that particular film responds to different wavelengths of light). At the same time, we typically profile the same film exposed through a variety of color filters. When you select a film, all these profiles are automatically loaded into the Spectral Response tab of the TrueGrain interface where you can select between them.
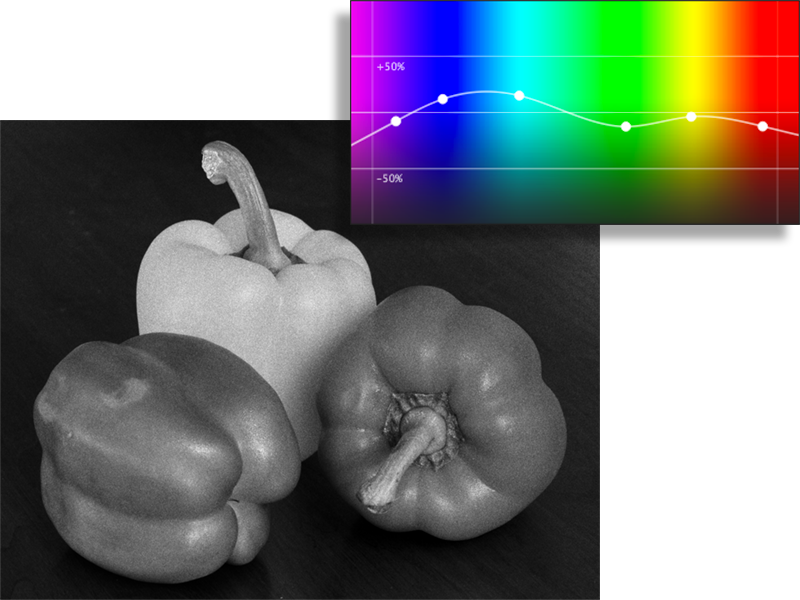
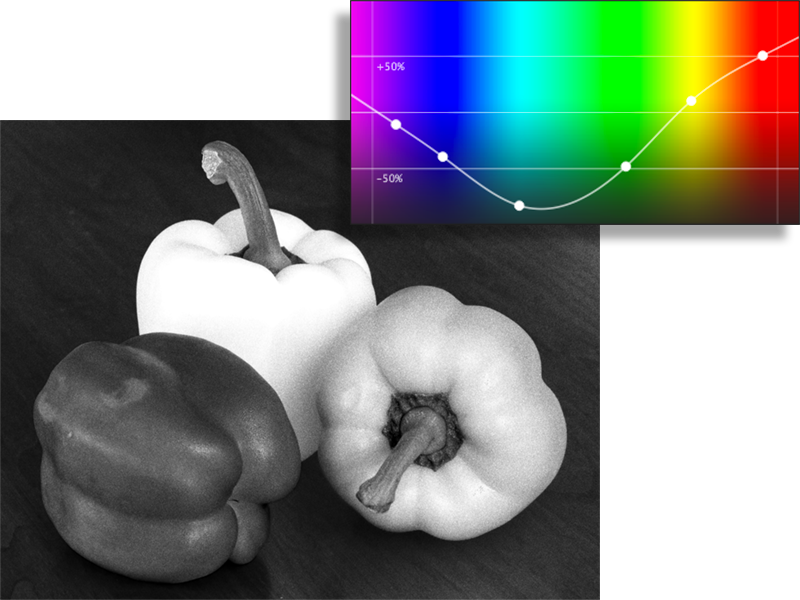
You will see the effect of the spectral response profiles most strongly in the saturated hues of your images. Below are two contrasting examples of brightly colored peppers. The first shows the normal spectral response for Ilford HP5 Plus, while the second is the same film but through a Wratten 25 Red filter.
You also have the option of manually manipulating the control points of the spectral response profile to achieve creative effects that no longer reflect the real-world behavior of the chosen film stock. In the following example, an exaggerated spectral response curve has been arbitrarily drawn for effect.
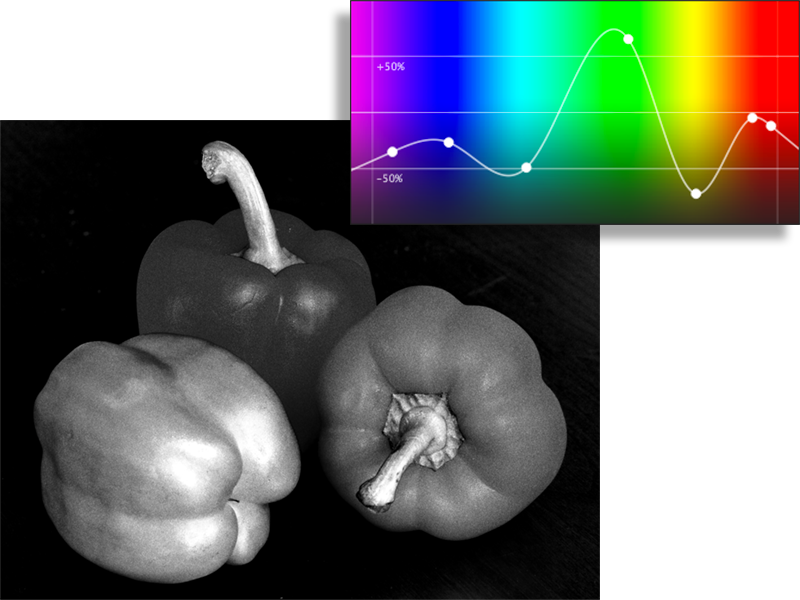
As with the other features of TrueGrain, changes you make to the spectral response are immediately reflected in the preview window.
The other side of the coin from spectral response is the overall nonlinear response of a given film stock to brightness. In TrueGrain, this behavior is expressed during grayscale conversion and is inversely related to saturation.
As with spectral response, each film implemented in TrueGrain gets a carefully measured dynamic range profile which is automatically loaded into the Dynamic Range tab of the interface. You will see the effects of the dynamic range profile most strongly in the neutral tones of your images.
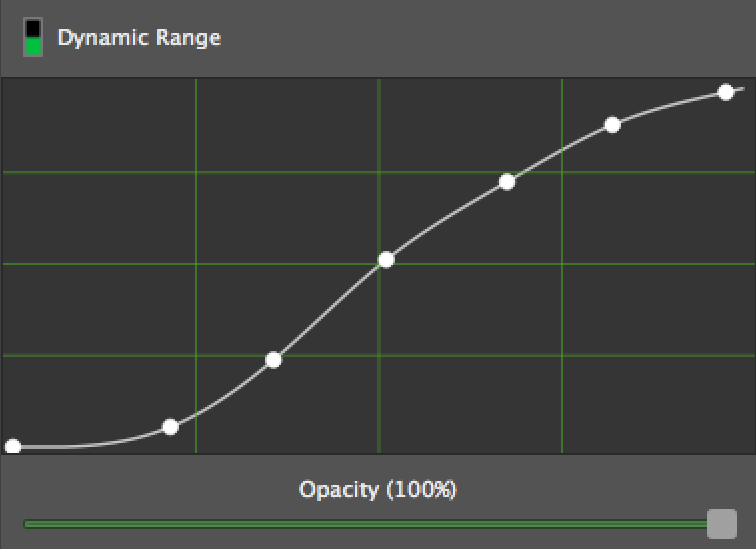
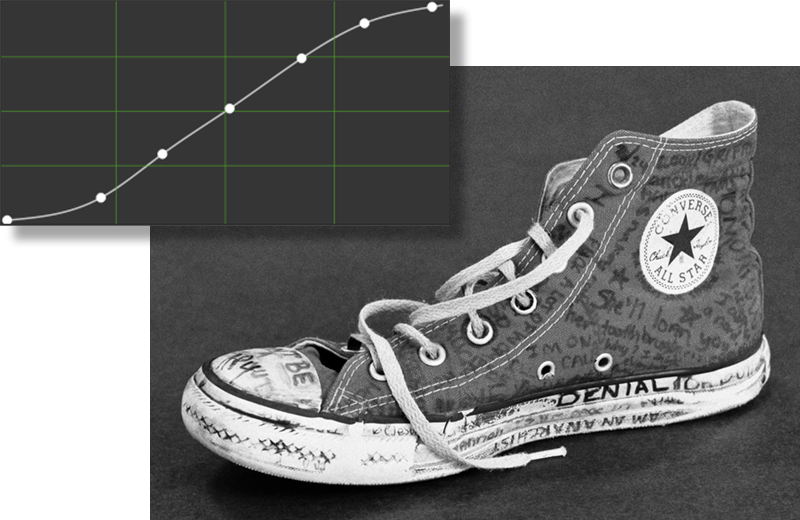
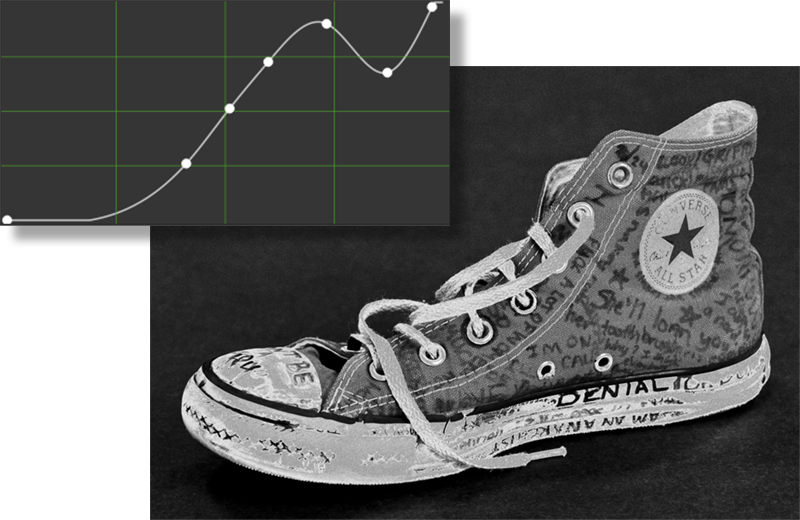
Sometimes the resulting dynamic range from the black and white conversion of your image does not meet your ideal or the particular characteristics of scanned film you are trying to match. In that case, you can manually manipulate the control points of the dynamic range profile to suit your tastes. The following two examples show the image first with the default, measured dynamic range curve and then with a manually-customized curve that enhances the image’s contrast.
Changes you make to the spectral response are immediately reflected in the preview window.
Each film implemented in TrueGrain includes laboriously photographed, developed, and scanned samples of genuine film grain from that particular stock. When you select a film, you are selecting the grain that will be applied to your image.
The most important controls on the Film Grain tab of the user interface pertain to the scale of that grain. Choices are provided that correspond to the size of the grain exposures that were actually scanned; these vary by film (for example, Kodak TMZ 3200 was only available in 135, while most others are available in full 120 size). You may also set an arbitrary scale percentage value with the slider. The grain size you choose will depend on the dimensions of your source image and the particular results you are seeking.
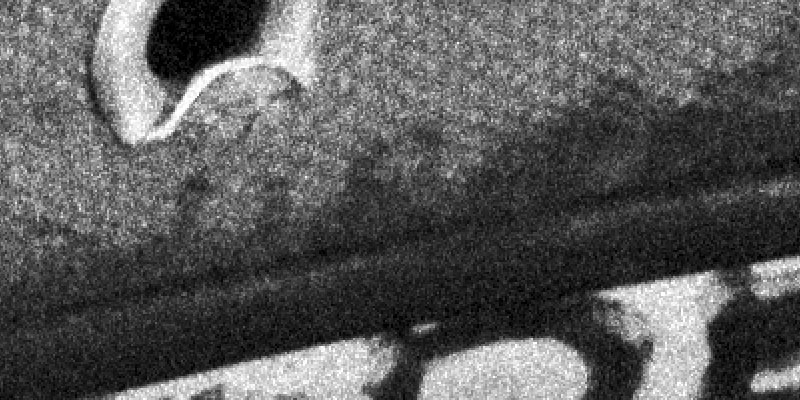
The following examples show 1:1 scale details of Ilford Delta 3200 grain applied to the same image at three sizes, 110, 135 and 6×8 respectively:


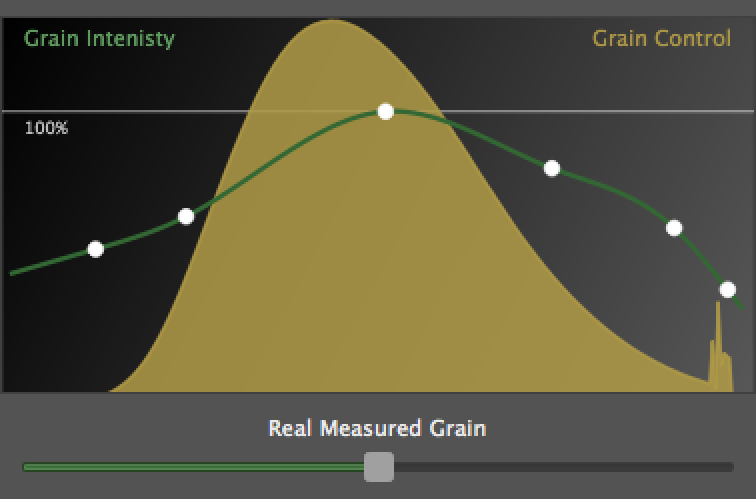
In the real world, graininess can be influenced by various factors such as the given batch of film and the development process. More fundamentally, the film grain of any given film expresses itself (“explodes”) non-linearly across the dynamic range of an image. Some films show little grain outside a narrow band of grays, whereas others show grain even the lightest whites. We measure and profile this behavior for each film, and the result is a curve you can manipulate for creative effects. In addition, a slider control is provided for biasing the intensity of grain according to your own creative preferences.
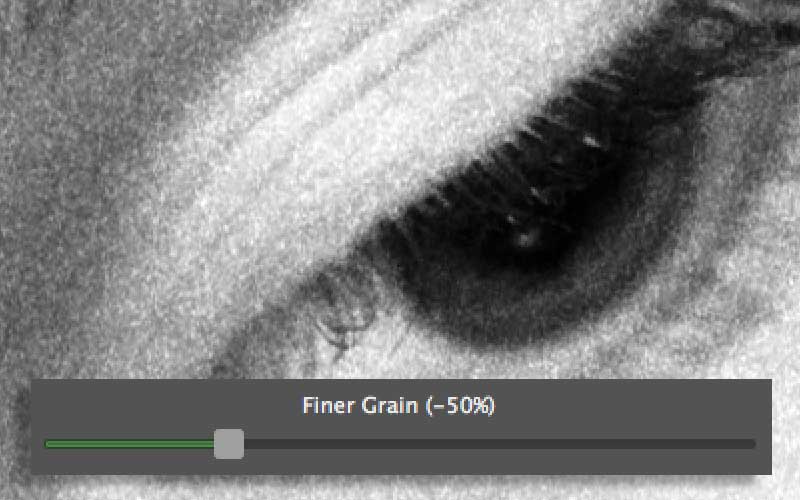
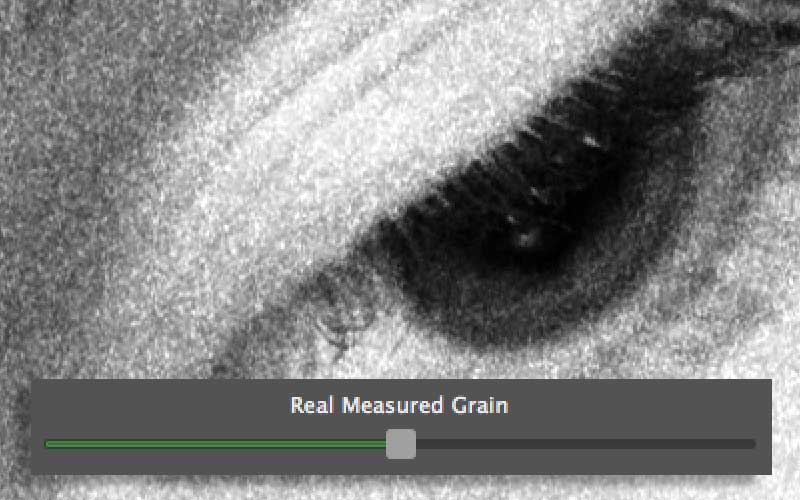
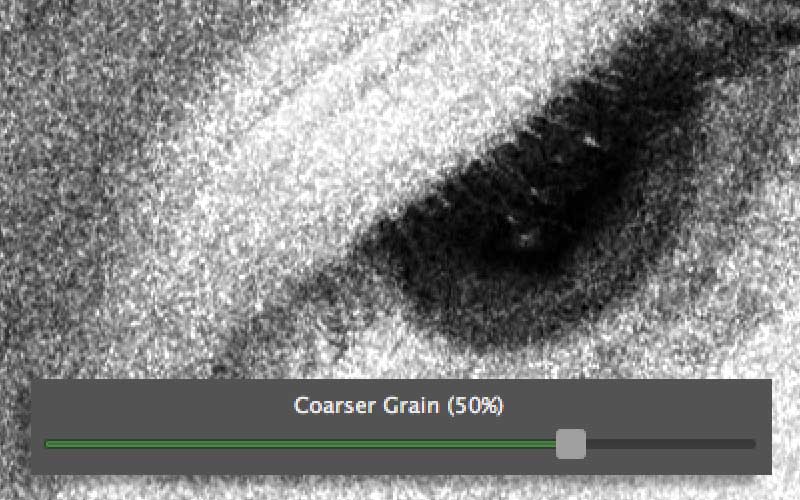
A handy slider is provided to override the measured behavior for aesthetic reasons, either in the stronger (coarser) and milder (finer) direction. These examples show Ilford HP5 Plus applied at -50%, default measured and +50%, respectively.
Copyright © 2024 Grubba Software. All rights reserved.
Privacy Policy - Contact/About Grubba Software - Media/Press Info
The trademarked names of film producers and their products referenced here are the property of their respective owners.